In our previous post, we discussed how the Janata Curfew impacted air quality in major Indian cities and the Delhi-NCR region in particular. In the second instalment of this series, we will discuss how the AQI levels in the metro cities indicate the effectiveness of the lockdown, thus resulting in a comparatively lower number of COVID-19 cases in India’s metro cities. We are now in the 2nd week of the lockdown and we see there is a huge improvement in Air Quality across India compared to the same period last year.
The GLens team conducted a pan-India, four-stage analysis to study the impact that COVID-19 has had on Indian air quality levels:
- AQI Dispersion map to compare pan-India AQI levels for 2 April 2020, 2 April, 2019 and 3 November, 2019– to see how the lockdown has exposed the perils of human activities.
- Comparison of this year’s (January 1- March 30, 2020) AQI levels with the same time range for last year (January 1- March 30, 2019) to achieve a realistic comparison of the lockdown in the metro cities.
- Correlation Plot of COVID-19 cases versus AQI in Chennai, Mumbai, Delhi & Bangalore to see if there is any correlation between the effectiveness of the lockdown & the number of COVID-19 cases.
The State of Indian Air Quality
In India, at this time of year, the Air Quality Index (AQI) levels generally tend to peak due to the continuous emission of hydrocarbons from industries and vehicles. About 65% of the pollution in India is due to urban emissions, with multiple pollution sources that emit gases like Carbon Mono-oxide, Methane, Benzene, Toluene, PM2.5, PM10, Sulphur-Di-Oxide, Nitrous-Oxide and other hydrocarbons.
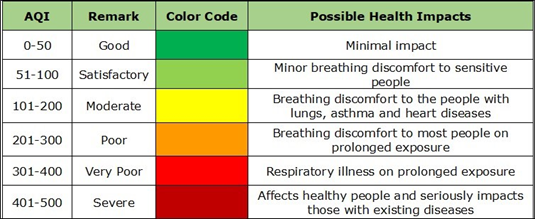
These gases are particularly hazardous when they are inhaled by us, and absorbed into the bloodstream. According to the World Health Organization (WHO), people who are exposed continuously to dangerous levels of AQI suffer from respiratory-related diseases that eventually reduce their lifespan.
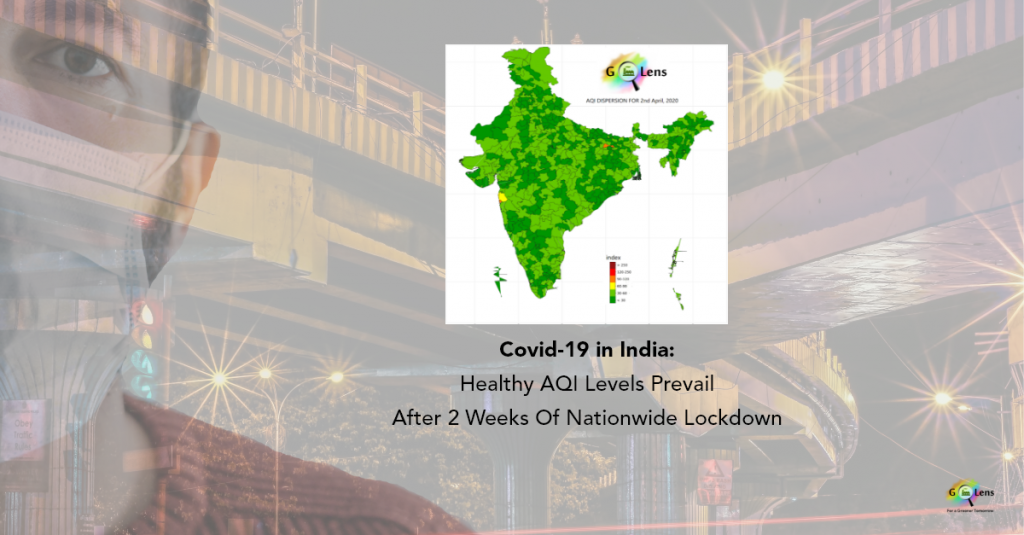
How have India’s AQI levels improved during the Nationwide Lockdown?
To understand how the nationwide lockdown has impacted India’s AQI levels, the GLens Analytics team has compiled data on how the AQI changed from January to the end of March (note that the lockdown was in place during the last 15 days of March).
At GLens, we provide Analytics for AQI in the form of Dispersion Maps. Through this, we can visualize the dispersion of AQI of a whole country considering Urban and Rural Emissions. To analyze the changes in AQI, we took the data, ran the model and depicted it in the form of a Dispersion Map.
AQI Dispersion Map for India on 2nd April, 2020
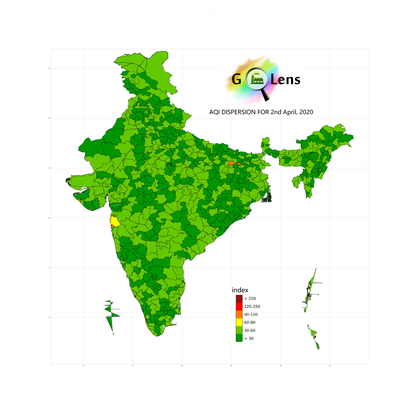
Figure 2: District-Wise AQI Data of India on 2 April, 2020
Referring to the data generated by CPCB, we at GLens ran the Model for 2 April, 2020. As seen in Figure 2, it is observed that the majority of the areas in India are at Healthy Levels due to the lockdown, with a few exceptions in the major cities.
There has been a considerably steep fall in vehicular and industrial emissions, that has played a crucial role in reducing the AQI to a minimal figure all over the country.
AQI Dispersion Map for India on 2 April, 2019
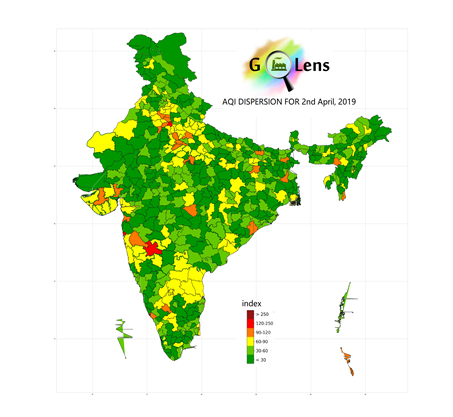
Figure 3: District-Wise AQI Data of India on 2 April, 2019
By referring to the same date of last year, we observed that the AQI Dispersion has been on a relatively larger scale over many districts, when compared to the same date of this year. More pollutants from vehicles and industrial areas have pushed up the AQI levels.
AQI comparison with 2019
On comparing the current year’s AQI levels (from January 1st to March 30th, 2020) to the same time range of last year, we arrive at very surprising results.
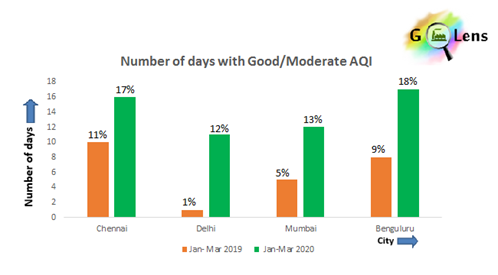
Figure 4: % Number of days with Good/ Moderate AQI (Source- CPCB 2020 and 2019 data)
From Figure 4, it can be concluded that the AQI data of 2020 has a greater number of Healthy zone percentages than compared to 2019’s AQI data.
In fact, the reduced pollution levels in March improved the air quality to a great extent, as can be observed in Figure 4. Note that the Green bar marks 10 days of Good/ Moderate AQI in Chennai in 2019, whereas it is 17 % of Good/Moderate AQI in 2020. The lockdown results can be seen clearly in the case Delhi, where the Good/ Moderate AQI % days in 2019 were a mere 2, but in 2020, it has increased to a staggering % of 10 days.
To analyze the pollution levels in different parts of the country, we have plotted the new cases of COVID-19 versus AQI in various Indian metropolitan cities.
Chennai:
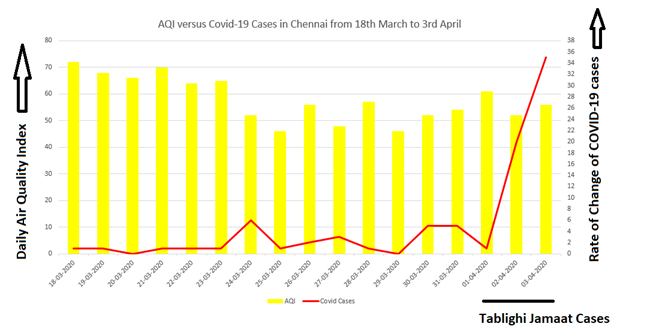
Figure 5: AQI Versus change in COVID-19 cases in Chennai from 18th March to 3rd April
Mumbai:
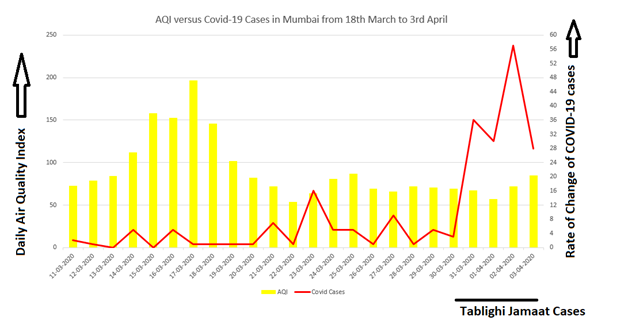
Figure 6: AQI Versus change in COVID-19 cases in Mumbai from 11th March to 3rd April
Delhi:
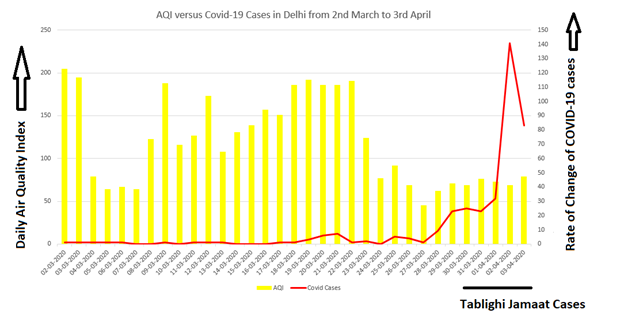
Figure 7: AQI Versus change in COVID-19 cases in Delhi from 2nd March to 3rd April
Bangalore:
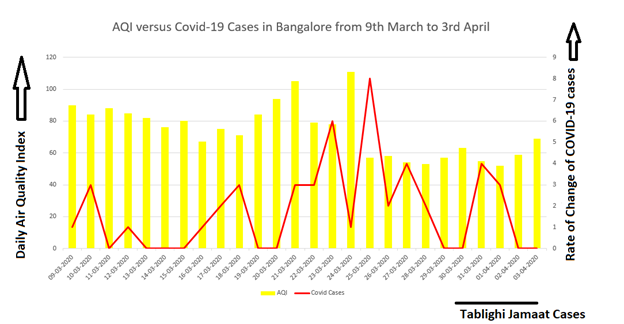
Figure 8: AQI Versus change in COVID-19 cases in Bangalore from 9th March to 3rd April
From the above analysis, we see that Delhi and Mumbai definitely see a drastic reduction in AQI due to the lockdown, compared to other metro cities. Also, these are the 2 cities that have experienced the maximum impact of COVID-19 cases.
Summing Up…
We see that the lockdown has definitely helped save human life both through a drastic reduction in Air Quality Index (as compared to the same period last year), as well as by reducing the number of new COVID-19 cases. We see that the correlation between new COVID-19 cases and the effectiveness of the lockdown has become slightly distorted due to some of the exceptional cases that came in towards the last week of March. We will continue to analyze this data and bring you meaningful insights on how the world is healing during the corona pandemic.
At Knowledge Lens, we truly believe that data speaks and data has a significant role in the creation of a sustainable future. If you would like to know more about our environmental data acquisition, monitoring and data analytics solution on GLens, let us know here.
Data Source: CPCB