After the implementation of the Janata Curfew (National Lockdown) for a single day on 22nd March 2020, India enforced an entire nationwide lockdown starting from 24th March till 3rd May to limit the spread of the COVID-19 pandemic. Today, we all can experience a cleaner environment due to the nationwide lockdown. In fact, there are plenty of news media accounts of how the lockdown has benefited the healing of Mother Earth.
In our first blog post, we discussed how the Janata Curfew impacted air quality in major Indian cities and the Delhi-NCR region in particular. In the second instalment, we discussed the correlation between good AQI levels and a comparatively lower number of COVID-19 cases in India’s metro cities. This week, we will take a deep dive & discuss the actual concentration levels of major pollutants, in comparison with the same data from last year.
Particulate Matter PM2.5, PM10 are some of the primary reasons for cardiovascular, respiratory, lungs-related diseases and preterm-birth. We have taken the PM2.5 concentrations in places in and around Delhi for this study. The comparison shows obvious results. Till the lockdown period, the trend is seen as more or less similar, but beyond the lockdown, a sharp drop in PM2.5 concentrations is observed.
In most of the cities in the country, the PM2.5 concentration remained below the National Ambient Air Quality Standards (NAAQS) of 60 Microgram/m3.
The analysis showed us extreme and clear drops in pollution levels, which are a direct result of reduced fuel consumption in transportation, industries, construction and energy sectors.

PM2.5 levels before and after the nationwide lockdown

PM10 levels before and after the nationwide lockdown
The data shows a transparent drop in particulate pollution after the lockdown. Delhi’s average PM2.5 concentration dropped from 59 micrograms (ug/m3) in March ( before the lockdown) to 34 micrograms after the lockdown. Overall, Delhi is breathing air that is 43% less polluted, with a 60% (=~) reduction in PM2.5 levels.
During the initial three-week lockdown period, the number of hours rated as “unhealthy” in Delhi dropped from 68% in 2019 to 17% in 2020, owing to transport and construction suspensions.
Besides particulate pollution, our analysis also covers Nitrogen Dioxide (NO2) levels’ data. It was observed that Delhi’s NO2 levels dropped by 71% during the lockdown.

NO2 levels before and after the nationwide lockdown
In fact, NO2 is also a key contributor to PM2.5 formation as it plays a significant role in secondary particulate formation.
Main Causes of reduction in NO2 levels:
- Drop in consumption of diesel/ petrol and other petroleum products in the transportation sector within cities. i.e., consumption of HSD (Diesel) decreased by 24% in March 2020 as compared to March 2019, with most of the reduction seen post lockdown. Overall, the consumption of petroleum products in Delhi as well as India decreased by 18% during the same period.
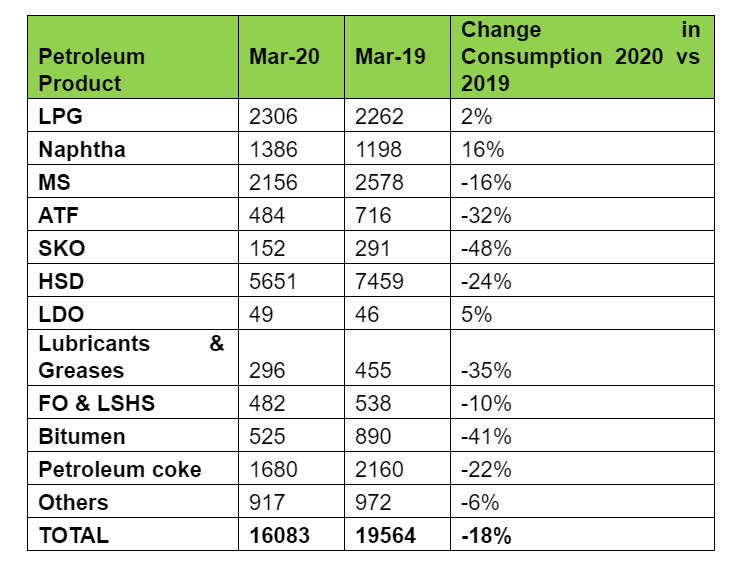
(Source: https://www.ppac.gov.in/)
- Decrease in consumption of petroleum products and coal by industries in regions within and around major cities. 11 of the 12 coal-based power plants situated within a 300 km radius of Delhi (Haryana, Punjab and Uttar Pradesh), except two units at Dadri Power Plant have been shut down due to low demand.
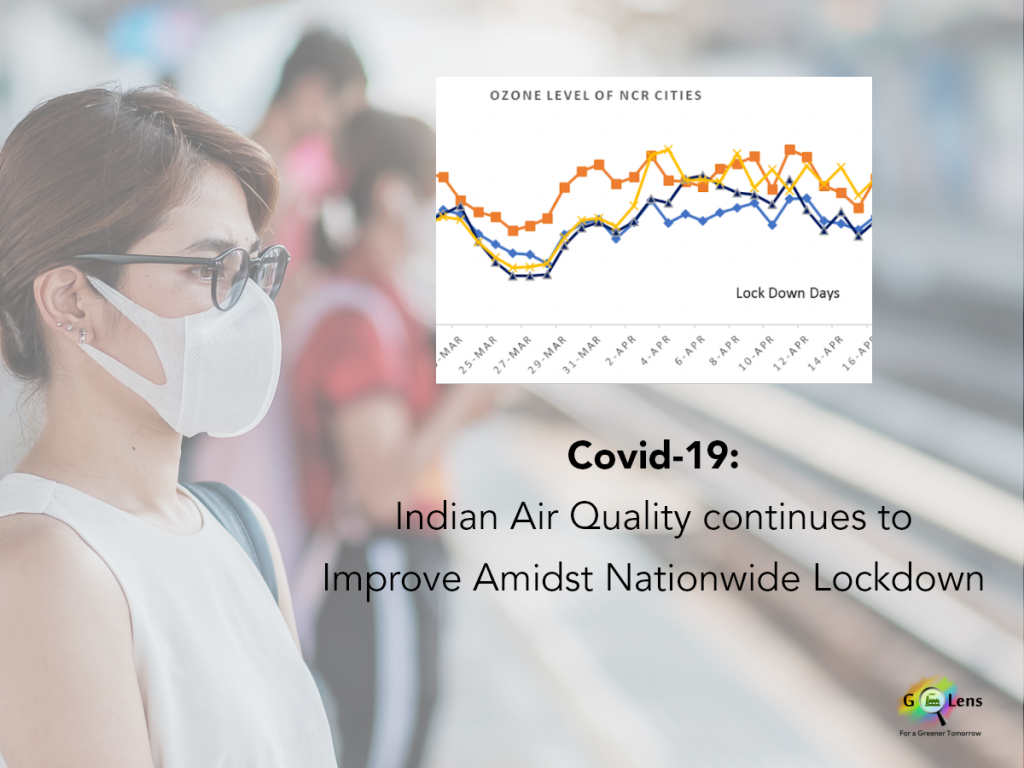
Ozone Alarm in Air:
As the pollution levels in major cities have gone down with the lockdown in place, the secondary pollutant Ozone is now emerging as the lead pollutant.In fact, Ozone has featured as the lead pollutant for four out of seven days last week– and this trend of Ozone is on the rise. Generally, Tropospheric Ozone is formed due to the reaction of NO2 with Solar Radiation and few traces of Volatile Organic Compounds (VOCs).
As noticed earlier, there is a drop in NO2 concentration and Ozone levels have increased. We have attempted an analysis of this trend by studying Temperature, VOCs, Solar Radiation and Relative Humidity. Out of these trends, Solar Radiation has shown some good results. Due to the reduction of PM2.5 and PM10 levels, dust concentration in the air has reduced, causing more Solar Radiation. This is conducive for further Ozone Formation. However, we cannot conclude that Solar Radiation is the only factor for this increasing trend of Ozone. The value has not crossed the prescribed standards of CPCB yet. Any suggestions on the matter are most welcome.

Comparison of daily Mean Solar Radiation of Delhi for the years 2019 and 2020
While the lead pollutants in Delhi are generally PM2.5 or PM10 throughout the year, the lockdown has shown how the lead pollutants are now ground-level ozone and NO2. Even though ozone is considered beneficial in the upper parts of the atmosphere, it becomes toxic at the ground-level and is considered a pollutant– breathing in high levels of Ozone can cause serious respiratory problems. This can also worsen pre-existing respiratory problems such as asthma and bronchitis, and can even cause permanent damage to the lungs.

Ozone levels before and after the nationwide lockdown

Delhi NCR Ozone Comparison before and after the nationwide lockdown
Last year, it was observed that the average ozone levels exceeded prescribed standards on 16% of the days between April 1 and June 15, 2019.
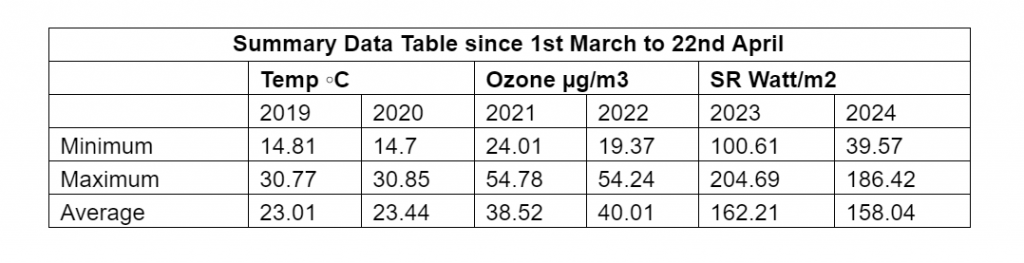
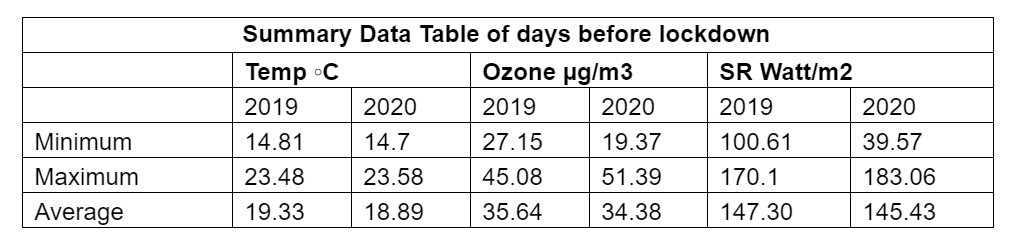
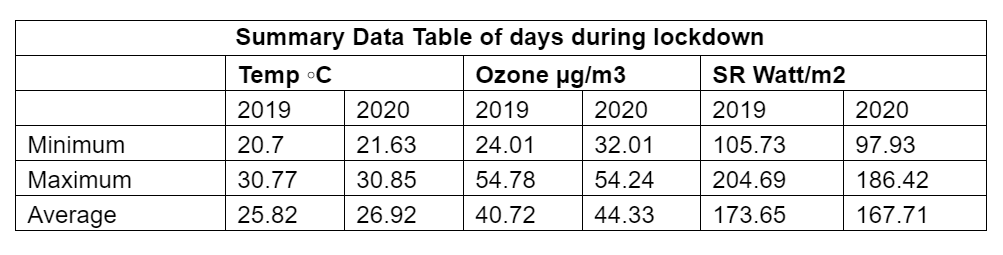
From the above three tables, it appears that there has been a slight increase in Average concentration of Ozone in 2020 as compared to 2019 during the lockdown, but the same hasn’t occurred before the lockdown.
Conclusion:
In this post, we have observed variations in several pollution levels. Though we have good air to inhale and exhale, it is still important that we remain cautious and vigilant. With COVID-19 primarily affecting the lungs, people should venture out only if it’s absolutely necessary, not to mention the higher levels of Ozone, which tends to peak in April.
In our blogs to come, we will analyze the data to ascertain if the Ozone levels go beyond prescribed limits during the lockdown, and compare it with last year’s data.
Disclaimer::
This blog post is purely based on our personal interest in exploring Environmental Data through a Data Science Lens. We are not advocating or promoting any of the conclusions here, and our findings are for strictly academic purposes. In case you have any questions or feedback, reach out to us at sai.praneeth@knowledgelens.com and manojkumar@knowledgelens.com.
CAAQMS Data Source: CPCB (Central Pollution Control Board)