In the wake of the Covid-19 pandemic, healthcare systems, educational institutes and companies have had to adapt to new working models, within just two weeks. While most news headlines point to a looming economic recession and an uncertain future, Indian Air Quality levels are a silver lining in these difficult times.
In order to understand the impact that Covid-19 has on Indian air quality, we studied the pollution level of major Indian cities on 22 March, 2020, the day that Janata Curfew, the nationwide lockdown was called for.
The GLens team conducted a survey on the air quality of major Indian cities with rampant pollution levels, in two stages:
- Air Pollution Level analysis
- Sound analysis
We observed that there was a direct and obvious correlation between these cities’ improved Air Quality Index (AQI) [1] and the nationwide lockdown. All these cities indicated reduced pollution levels due to the significantly reduced vehicular emissions and noise levels.
- Air Pollution Level Analysis
On 22 March 2020, the Air Quality Index (AQI) of Guwahati in North-East India was recorded as 223, with PM2.5 as maximum parameter, while Chennai recorded the least AQI of 72 with PM10 as maximum parameter.
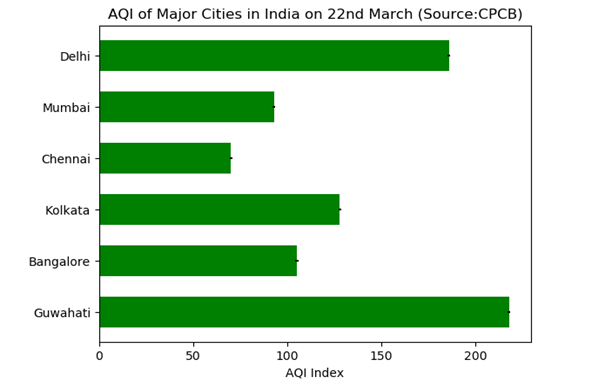
Figure-1: Air Quality Index (AQI) in major Indian cities
Here, Figure-1 provides the AQI of the major Indian cities, which the CPCB (Central Pollution Control Board) acquires and monitors via sophisticated environmental data acquisition techniques.
Next, we compared these pollution levels with the previous year– 22 March, 2019. As the vast majority of residents in major cities stayed home without venturing outside on the Janata Curfew Day, a sudden drop in pollution levels was observed.
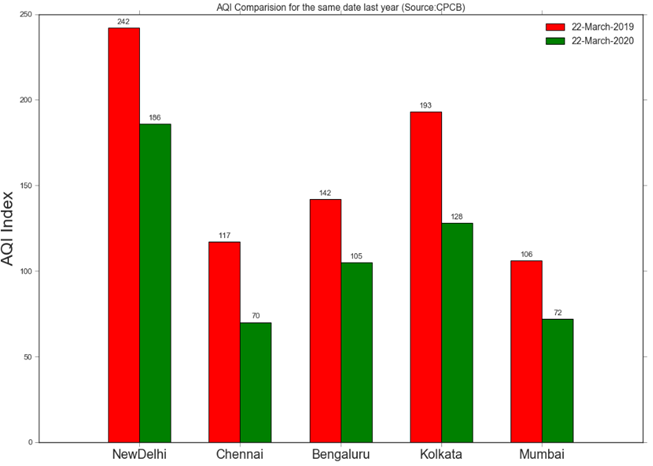
Figure-2: AQI Comparison for the similar days (22 March 2019 & 2020)
On this day, the typically high levels of pollution caused by vehicular emissions reduced, bringing down the overall AQI. Considering the NCR region alone, we observed minimal pollution recorded in the North-West parts of the city owing to very less traffic and the north-westerly winds. As the winds on 22 March 2020 were predominantly from the North-West, small-scale pollution in Delhi was accumulated in the South-east and Central parts, pushing up the overall AQI to 184.
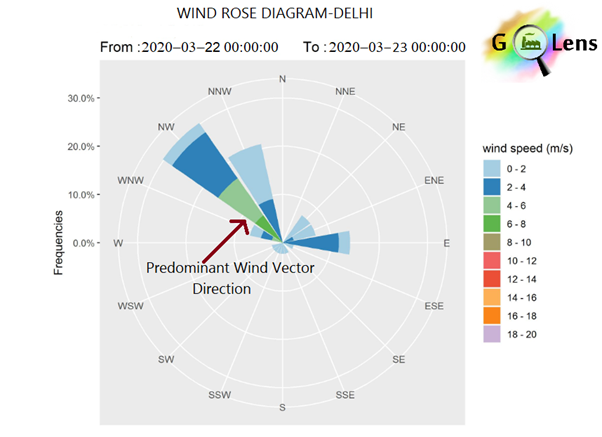
Figure-3: Wind Rose Diagram of Delhi on 22 March 2020
The above Wind Rose Diagram provides the exact reason behind the AQI accumulation in the NCR region on 22 March. In Figure-3, we can observe that the predominant wind direction is from the North-West.
2. Sound Analysis
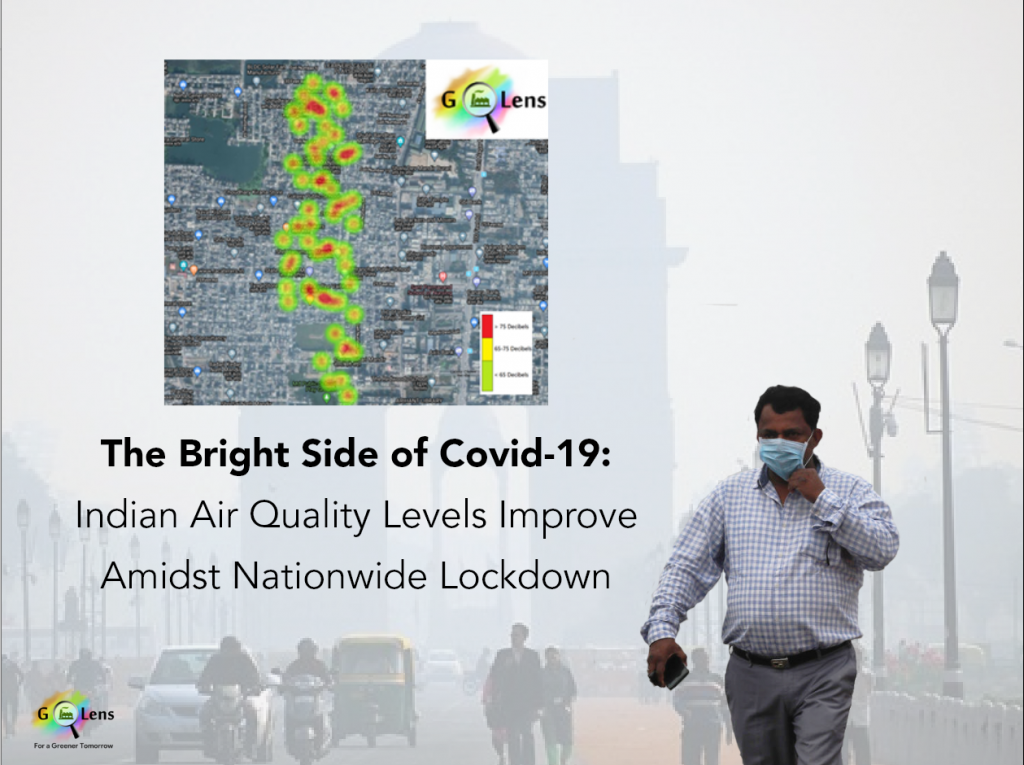
We performed a noise-level analysis of the Burari area in North Delhi.
On a typical day, the noise levels along the 100 Feet Road (in map), would be alarming. However, on 22 March 2020, it was close to 0. Some noise (65-75 decibels) was still detected in the interior regions where the locals were interacting with each other. The modeling results depicted here are mainly due to the daily activities of people and the use of speakers inside homes.
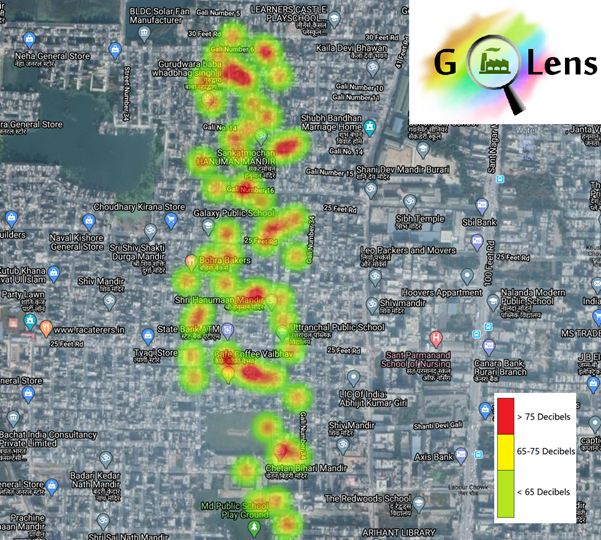
Figure-4: Noise Modeling of Burari, Delhi on 22 March 2020
Pollution Levels of Anand Vihar, Delhi: Comparison of February & March 2020
Next, we analyzed the pollution levels in Anand Vihar, one of Delhi’s busiest bus terminals (ISBT). We studied the air quality with respect to the concentration of PM2.5, PM10 & NO2 particles[2]. We noticed that for the period of March 21-25, compared against February 2020, pollution levels have gradually reduced, in alignment with the lockdown.
What we Observed-
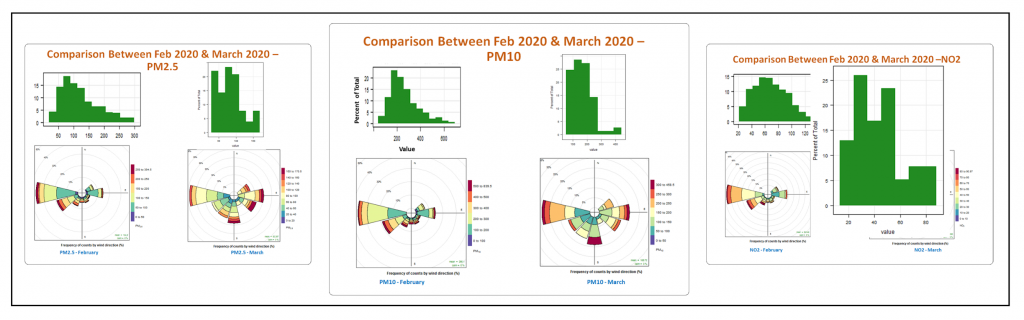
Pollution Rose Plot depicting comparison of PM2.5, PM10 & NO2 pollution levels
between February 2020 and March 2020
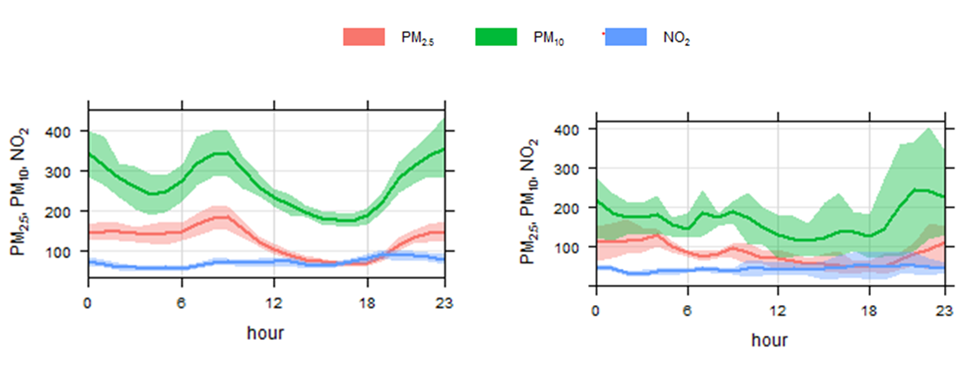
Time Variation Plot depicting comparison of PM2.5, PM10 & NO2 pollution levels
between February 2020 and March 2020
The Outcome
In the following charts, we have drawn a comparison of PM2.5, PM10 & NO2 pollution levels between February 2020 and March 2020-
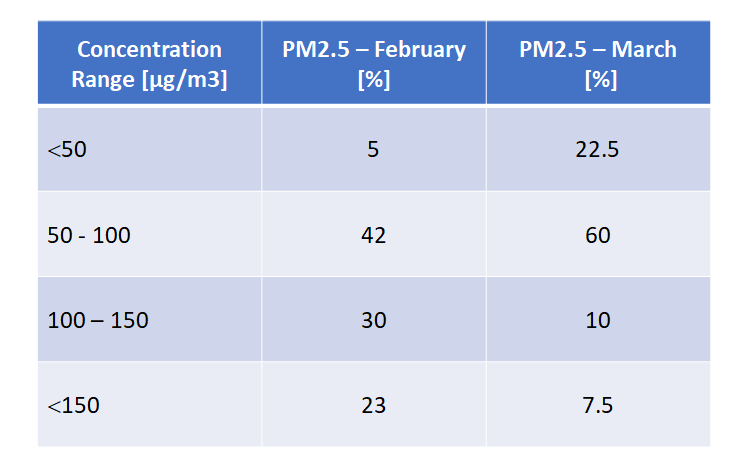
PM2.5 Concentration Trend between February and March 2020
Comparison of PM2.5 concentrations between February & March 2020 shows a significant reduction owing to the complete lockdown in Delhi and the subsequent reduction in vehicular emissions. In March, the less concentration range (between 0 – 100µg/m3) is 82.5% higher than the high concentration range (more than 100µg/m3), compared to February, where the higher concentration range ( more than 100µg/m3) is at 53%.
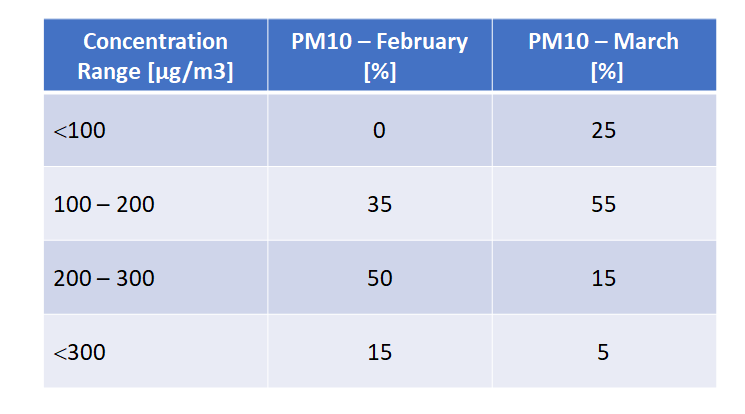
PM10 Concentration Trend between February and March 2020
Comparison of PM10 concentrations between February & March 2020 reveals that pollution levels dropped in March as a direct result of the lockdown in Delhi and the subsequent reduction in vehicular emissions. In March, the less concentration range (between 0 – 200µg/m3) is 80% higher than the high concentration range (more than 200µg/m3). In comparison, in February the higher concentrations (more than 200µg/m3) stands at 65%.
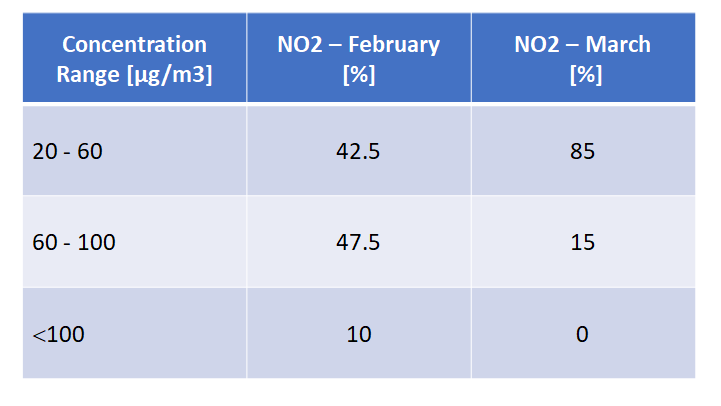
NO2 Concentration Trend between February and March 2020
Comparison of NO2 concentrations between February & March 2020 shows a significant reduction owing to the complete lockdown in Delhi and the subsequent reduction in vehicular emissions. In March, it is observed that the less concentration range (between 20 – 60µg/m3) is 85% higher than the high concentration range (more than 60µg/m3), as compared to February when the higher concentration (more than 60µg/m3) is at 57.5%
Summing Up…
In this post, we have considered the AQI of major Indian cities and taken a deeper dive to understand the particulate matter pollution levels of Delhi’s Anand Vihar bus terminus.
We will continue to update you on a weekly basis with more information on Delhi & the NCR region’s AQI levels over the course of the ongoing 21-day lockdown. We will examine the correlation between the lockdown, reduced vehicular emissions and AQI levels in greater detail.
At Knowledge Lens, we truly believe that technology plays a significant role in the creation of a sustainable future. If you would like to know more about our environmental data acquisition, monitoring and analysis solution GLens, let us know here.
Source: CPCB Air Data
[1] Air Quality Index (AQI) is an overall scheme, based on National Ambient Air Quality standards, which transforms individual air pollutant (e.g. SO2, CO, PM10) levels into a single number, indicating the air pollution status of a particular location. Because it converts complex air quality data into a single color-coded number, it provides comprehensive information that is easy to understand.
[2] PM2.5 refers to harmful atmospheric particulate matter (PM) that have a diameter of less than 2.5 micrometers. PM10 refers to harmful atmospheric particulate matter (PM) that have a diameter of less than 10 micrometers. Nitrogen Dioxide (NO2) is one of a group of gases called nitrogen oxides (NOx). While all of these gases are harmful to human health and the environment, NO2 is of greater concern, and is produced by the burning of fuel.